

Why AWS issues keep your team up at night — and how this guide helps
Imagine it’s the middle of the night. Your phone buzzes. An alert means something is wrong with your cloud services.

This is a common worry for engineering teams today, as unexpected aws issues can stop your services from working right. When systems in the cloud break down, it can cost companies a lot of money and make customers unhappy. These problems might be small at first, but if they are not fixed quickly, they can grow into big headaches.
Keeping an eye on all your cloud services is a big job. Sometimes, even knowing where to start when something goes wrong can feel confusing. Dealing with [aws issues] is a common part of working in the cloud in 2026. Teams need a good plan to quickly find and fix problems. Good incident management means having clear steps to follow, so you don’t waste time figuring things out when every minute counts. Having a strong plan is key for keeping things running smoothly, according to best practices in handling incidents in 2026 Incident management best practices: Complete guide 2026.
This guide is here to help you and your team feel more ready. We will show you how to troubleshoot common problems step by step. You will find easy-to-use playbook templates that you can use right away. We will also share smart ways to keep an eye on your cloud systems, called observability patterns. These tips are for both engineers who fix problems and managers who lead the teams. Our goal is to give you the tools you need to stop [aws issues] from ruining your night and to make sure your cloud systems are always working their best.
To stay on top of all the fast changes in technology, especially with AI influencing how we manage cloud issues, make sure you’re getting the best information. Get clear daily AI updates from The AI Newsletter Worth Reading.
A Troubleshooting Primer: Triage, Isolation, and Hypothesis-Driven Debugging
When aws issues pop up, knowing exactly what to do first is super important. It is like having a clear map when you are lost. A good plan helps your team fix problems fast and keep your cloud services running smoothly. This plan often starts with a clear process for dealing with problems, called triage.
Your Step-by-Step Triage Workflow
A strong triage workflow helps you tackle problems in a smart, organized way. It moves through different stages, making sure you fix the issue and learn from it. Many teams follow steps like detect, prioritize, isolate, mitigate, root-cause, and learn.
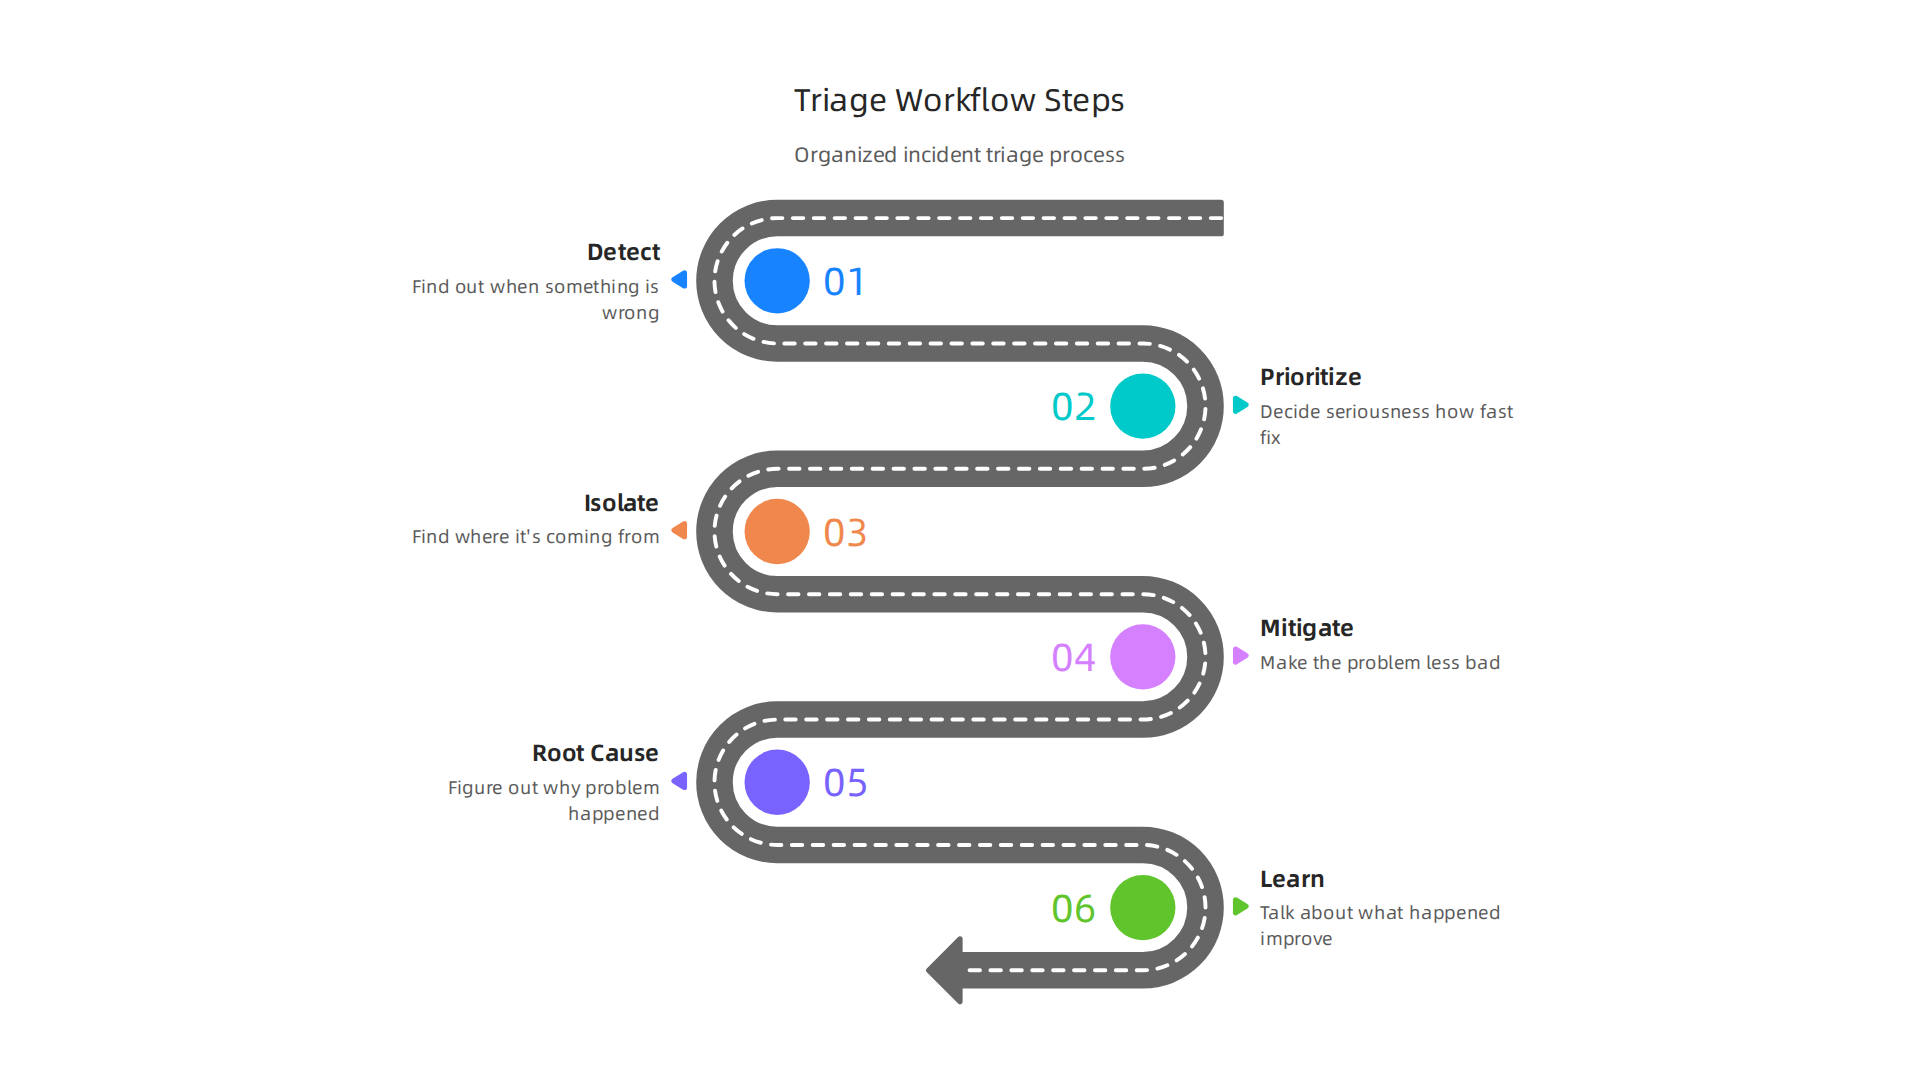
This helps guide you from finding a problem to preventing it from happening again. In fact, many modern approaches in 2026 outline incident response in clear stages from detection to resolution AI Agent Incident Response: From Alert to Fix.
Let’s break down each step:
- Detect: This is about finding out when something is wrong. Your systems should be set up to tell you right away if an
aws issueoccurs. This can happen through alerts or monitoring dashboards. Sometimes, just checking theaws status pagecan give you an early heads-up. For better cloud operations, relying only on the basic AWS console might not be enough anymore in 2026, and you’ll need more advanced tools Your AWS console isn’t enough anymore: Here’s what you need for cloud operations in 2026. - Prioritize: Not all problems are equally bad. You need to quickly decide how serious the issue is and how fast it needs to be fixed. Is it stopping customers from using your service? Or is it a small glitch that can wait a little?
- Isolate: Once you know a problem exists, you need to find exactly where it is coming from. This means figuring out which part of your system is broken. Isolating helps stop the problem from spreading and makes it easier to focus your fixing efforts. When dealing with cloud problems, this might involve checking affected accounts or reviewing logs SOC Playbook Template & Incident Response ….
- Mitigate: This step is about making the problem less bad, even if you do not have a full fix yet. It could mean restarting a service, rerouting traffic, or rolling back a recent change. The goal is to get things working well enough for your users while you work on a permanent solution.
- Root-Cause: After the system is stable, you need to figure out why the problem happened. This often involves a deep look into what went wrong, collecting evidence, and rebuilding a timeline of events Security incident investigation: the 7-step SOC workflow. Understanding the real cause helps prevent the same issue from happening again.
- Learn: The final step is to talk about what happened. What did your team do well? What could be done better next time? This learning helps you improve your systems and your response plan for any future
aws issues.
Hypothesis-Driven Debugging: Be a Detective
Troubleshooting can sometimes feel like looking for a needle in a haystack. This is where "hypothesis-driven debugging" comes in handy. It means you act like a detective. Instead of trying random fixes, you form a smart guess (a hypothesis) about what might be causing the problem.
For example, if your website is slow, your guess might be: "The database is overloaded."
Then, you create a small, safe test to check your guess. You might look at the database’s usage numbers. If they are very high, your guess might be right. If they are low, your guess was wrong, and you can try a new one, like "The web server has too many requests."
The key is to make your tests small and careful. You want to test your ideas without making the problem worse for everyone using your service. This way, you learn what is wrong piece by piece, without causing more trouble. This smart way of working helps your team solve problems faster and with less risk.
Catching aws issues fast is super important, like spotting a small crack before it becomes a big problem. The faster you know about an issue, the sooner you can fix it. This helps keep your websites and apps running smoothly for everyone. To do this well, you need to understand what signs your systems give off, how to listen to them, and how to ignore the less important chatter.
Finding High-Value Signals from Your Cloud Services
Think of your cloud services as sending out lots of messages. Some messages are super important, like "Help, I’m broken!" Others are just background noise, like "Everything is normal." We want to focus on the important messages. These important messages come in three main types:
- Metrics: These are numbers that tell you about your system’s health. Things like how much CPU your servers are using, how much memory is left, or how many people are visiting your website. In 2026, many teams use Service Level Objectives (SLOs) to set clear goals for these numbers. For example, you might want your website to be up 99.9% of the time Best Practices for Monitoring with AWS and OpenTelemetry. If these numbers start to look bad, it’s a signal. You can track important metrics like error rates and response times to understand service performance The Complete Guide to AWS Service Monitoring with ….
- Logs: These are like diaries for your applications. They record every event that happens, big or small. If something goes wrong, the logs can tell you exactly when it happened and what was going on at that moment. Collecting these logs is a key part of seeing what’s truly happening inside your system OPS04-BP02 Implement application telemetry.
- Traces: Imagine following a single customer’s journey through your app. Traces let you do just that. They show how a request moves from one part of your system to another, helping you see where delays or errors might be happening. Tools like Amazon CloudWatch Application Signals use OpenTelemetry to gather these traces, making it easier to see how different parts of your application are working together
Amazon CloudWatch Application Signals, for …. OpenTelemetry helps you collect all these different signals, no matter which cloud you use OpenTelemetry – Amazon CloudWatch.
Quieting the Noise: Smarter Alerts
Getting too many alerts is like having a fire alarm that goes off every time you burn toast. Soon, no one pays attention. This is "alert noise," and it makes it harder to spot real aws issues. To fix this, we need smarter alerts:
- Focus on SLOs, not just static numbers: Instead of an alert for "CPU over 80%," think about "Is my service still meeting its speed goals for users?" This is called "burn rate" alerting. It tells you if you are using up your "error budget" too quickly. Many teams in 2026 have moved away from simple alerts to ones based on how quickly things are going wrong, also known as burn rate alerts Site Reliability Engineering 2026: SRE Best Practices for the …. This helps to create meaningful alerts that truly show a problem Alerting on SLOs like Pros.
- Multi-window alerts: This means an alert only goes off if a problem lasts for a certain amount of time. A quick spike might not need an alert, but a longer issue probably does. This helps reduce false alarms and focuses on real problems SLOs and Error Budgets: A Tier-1-Sourced Field Guide (2026).
- Regular review: You should often check if your alerts are still helpful. Are they catching the right things? Are they too chatty? It is like tuning a radio to get a clear signal.
Making Alerts Work Smarter: Prioritization and Escalation
Once an alert fires, what happens next? You need clear rules:
- Prioritization: Not all problems are equal. An issue stopping all customers is critical. A small slowdown might be less urgent. Your alerts should have different levels of importance. Clear SLO targets help you decide what is most important to alert on How to Build SLO Alerting Strategies.
- Automated Escalation: For urgent
aws issues, alerts should automatically go to the right people. This might mean texting a senior engineer after hours if an important service breaks. The goal is to reduce the time it takes from when a problem starts to when someone starts working on it. This helps reduce your team’s time-to-detect.
Remember, a simple check of the official AWS Status Guide for Engineering Teams can also give you a good overview of large-scale issues affecting AWS services. Getting good at detecting problems early and clearly helps your team focus on fixing what matters most without being overwhelmed by unnecessary noise.
After setting up smart alerts, the next step is to understand what might actually go wrong with your cloud services. Many aws issues are specific to the type of service you are using. Knowing these common problems helps you look in the right places when something goes sideways. Let’s look at typical issues in popular AWS services like EC2, EKS, RDS, S3, and Lambda, and how to quickly check them.
Spotting Problems in Specific AWS Services
Each AWS service has its own quirks and common failure points.
-
EC2 (Virtual Servers)
EC2 instances are like virtual computers. Common issues include the instance stopping or failing to start, network problems preventing access, or the disk filling up. You might also see performance slow down if the server runs out of CPU or memory.- Quick Check: Look at the instance status checks in the AWS console. Check network settings and security groups to make sure traffic can flow. See if the disk has enough space. For deeper insights, remember to set up good logging and metrics for your instances, avoiding common monitoring anti-patterns that can hide problems Top AWS CloudWatch Anti-Patterns.
-
EKS (Kubernetes)
EKS helps you run many small parts of your application (called containers) in a smart way. Issues here often involve pods (your application containers) failing to start, problems with how pods talk to each other, or the entire EKS cluster having health problems.- Quick Check: Look at the EKS cluster health dashboard. Check logs for failing pods to see why they can’t run. Make sure network policies allow your services to communicate.
-
RDS (Managed Databases)
RDS offers managed databases like MySQL or PostgreSQL. Common problems are slow database queries, too many connections crashing the database, or running out of storage space. Sometimes, replication issues can occur if you have read replicas.- Quick Check: Monitor database metrics like CPU usage, free storage, and the number of active connections. Check the database logs for slow queries or errors. You can send custom metrics to CloudWatch to keep a close eye on your database’s health Amazon CloudWatch – FAQ.
-
S3 (Object Storage)
S3 is for storing files like images or documents. The main issues here are usually about access. You might get "Access Denied" errors if permissions are wrong, or "Bucket Not Found" if you typed the name wrong. Slow uploads or downloads can also happen, especially for large files.- Quick Check: Review S3 bucket policies and IAM permissions to ensure users or services have the right access. Test uploading and downloading small files to check basic connectivity.
-
Lambda (Serverless Functions)
Lambda functions run your code without you managing servers. Common problems include functions timing out if they run too long, running out of memory, or "cold start" delays where the function takes longer to begin. Missing permissions are also a frequent cause of Lambda failures.- Quick Check: Look at Lambda function metrics like duration, error rate, and throttles. Check the function logs for error messages. Ensure the Lambda execution role has all the necessary permissions. The Complete Guide to AWS Service Monitoring with OpenTelemetry for 2026 mentions key metrics for Lambda such as duration, error rate, and throttle count.
Digging Deeper: Underlying Causes
Sometimes, the problem isn’t just with one service. It can be a wider issue affecting many parts of your setup.
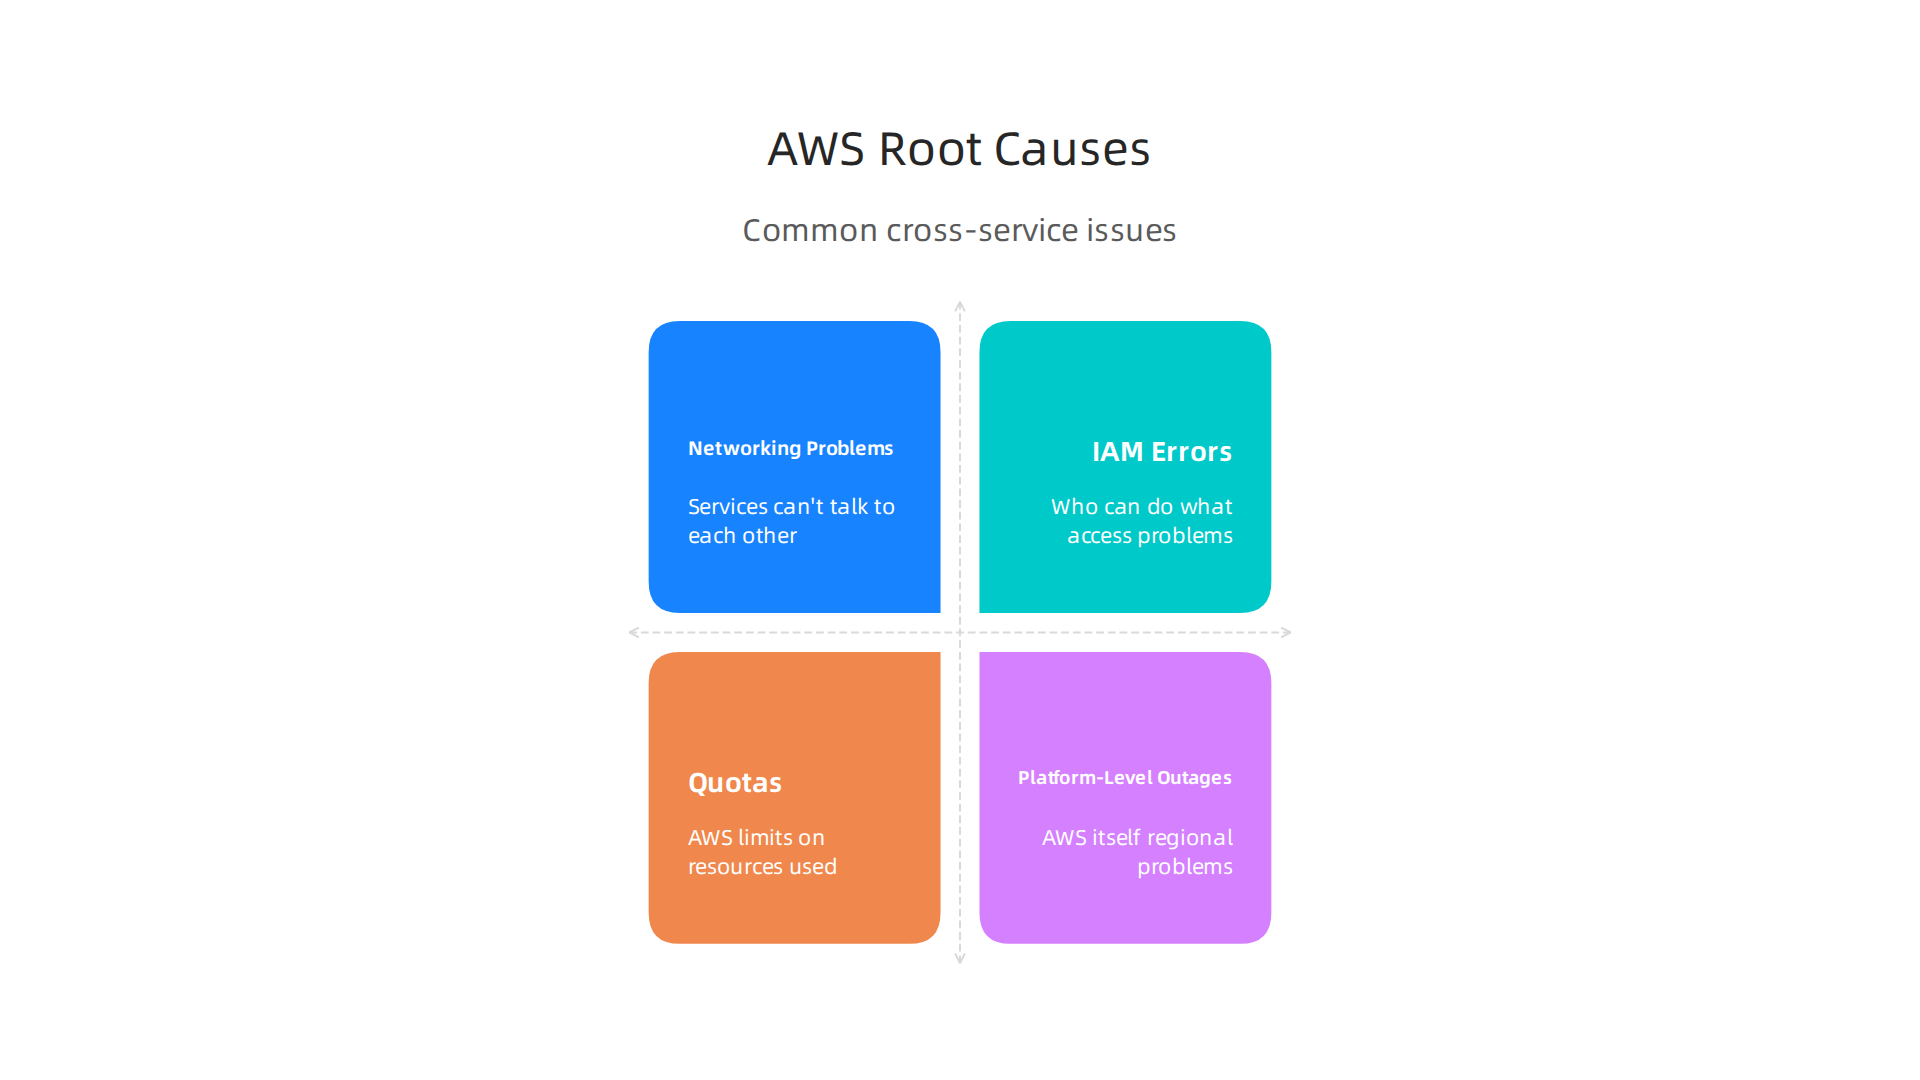
- Networking Problems: If many services can’t talk to each other, it might be a network issue. This could be problems with Virtual Private Clouds (VPCs), subnets, routing tables, or security groups that act like firewalls. Checking these network pieces is a core part of figuring out why things are not working.
- IAM (Identity and Access Management) Errors: IAM handles who can do what in your AWS account. If a service or user can’t access a resource they need, you might see "permission denied" errors across the board. This is a common root cause for
aws issues. Always check IAM roles and policies when many things fail unexpectedly. - Quotas (Service Limits): AWS has limits on how many resources you can use. For example, you can only run a certain number of EC2 instances in a region. If you hit these limits, new resources won’t start, or existing ones might stop working right.
- Platform-Level Outages: While rare, AWS itself can have regional problems that affect many services. This is when the AWS Status Guide for Engineering Teams becomes very helpful, as it tells you about big issues outside your control.
- Application Bugs: Finally, sometimes the issue is simply a mistake in your own code. Even with perfect AWS services, a bug in your application can cause errors, crashes, or slowdowns. Monitoring your application’s logs and traces (as discussed earlier) helps you tell the difference between an AWS problem and an application bug.
To prevent and quickly solve these issues, it is essential for engineering teams to have clear strategies for how engineering teams evaluate technology services. Moreover, understanding that your AWS Console isn’t enough anymore for cloud operations in 2026 is key. You need better tools and practices for full visibility.
To prevent and quickly solve aws issues, simply having good monitoring is not enough. As we discussed, your basic AWS Console isn’t always enough to give you the full picture. What you really need is "observability." Observability is about understanding what’s happening inside your systems just by looking at the data they send out. It’s like having X-ray vision for your cloud setup. The three main parts of observability are logs, traces, and metrics.
When used together, they help you find and fix problems much faster.
Observability Patterns: Logging, Tracing, and Metrics That Speed Resolution
Good observability means you don’t just know that something is wrong, but you can also figure out why it’s wrong quickly. It’s all about making sure your systems give you useful clues when things go sideways.
Actionable Logs
Logs are like diaries for your applications. Every time something important happens, your application writes a note.
- What they are: Text records of events, errors, or activities.
- How they help: They tell you the exact steps that led to an
aws issuesor an application problem. For example, a log might show an "Access Denied" error with details about which user or service tried to access what. - Making them actionable: Don’t just dump all information into logs. Focus on including enough detail to understand the context, like unique request IDs or user information. Make them easy to search and read. Good logs are crucial for figuring out the root cause, as mentioned in many templates for handling incidents, which often start by reviewing system logs to understand the event timeline. An effective Incident Response Runbook Template for DevOps highlights the importance of detailed logging for quick acknowledgment and resolution.
Distributed Tracing
As applications grow more complex and use many different cloud services, a single request might bounce between five, ten, or even more components. This is where tracing comes in.
- What it is: Tracing connects all the steps of a single user request across different services. It shows you the path a request took and how long each step lasted.
- How it helps: If a request is slow or fails, tracing pinpoints exactly which service or part of the code is causing the delay or error. This is very powerful for finding bottlenecks in complex microservice setups, especially when dealing with tough
aws issuesthat span multiple systems. - Finding root causes: Tracing helps you connect a user-facing problem to a specific service and even a specific line of code or database query.
Meaningful Metrics
Metrics are numbers that tell you about the health and performance of your systems over time.
- What they are: Measurements like CPU usage, memory use, network traffic, error rates, or the number of requests per second.
- How they help: They let you see trends, spot sudden changes, and predict potential
aws issuesbefore they become big problems. For instance, if your database’s CPU usage slowly climbs, you know to investigate before it maxes out. - SLO-based alerting: In 2026, a key trend is alerting based on Service Level Objectives (SLOs) and error budgets. Instead of just alerting when a static number is hit (like 80% CPU), you set a goal for how well your service should work (its SLO). If your service uses up its "error budget" (the small amount of errors you allow) too quickly, it triggers an alert. This method helps you get alerts that truly matter to your users. Site Reliability Engineering 2026: SRE Best Practices emphasizes that SLOs are central to reliability and alert on "error budget burn rate." It is crucial to define and measure reliability using SLOs, which should be achievable, meaningful, and measurable, according to experts on what is an SLO and why should I use SLO-based alerts?
Connecting the Dots: Correlation Strategies
The real magic happens when you bring logs, traces, and metrics together. Imagine you get an alert (from a metric) that your website’s error rate is spiking.
- You check your tracing tools, and they show that most failed requests are hitting a specific backend service.
- You then jump into the logs for that service, using the trace ID to quickly find the exact error messages. This combination helps you find the problem much faster than looking at each piece of data separately.
Balancing Retention and Cost
Storing all this observability data can get expensive, especially as your systems grow. You need to find a good balance:
- What to keep: Keep high-resolution metrics for a shorter time (e.g., a few weeks) and aggregated data for longer trends (e.g., a year).
- Log storage: Decide which logs are most important to keep for long-term troubleshooting or compliance, and which can be stored for a shorter period.
- Cost trade-offs: Understand that more data means more cost. Focus on collecting data that is truly actionable and helps you resolve
aws issuesand other problems efficiently.
By focusing on these observability patterns, engineering teams can build systems that don’t just work, but also tell you when and why they’re not working, making troubleshooting much smoother. Staying on top of engineering technology trends in 2026 is also essential for maintaining a competitive edge.
Want to learn more about how AI is shaping the future of software development?
The AI Newsletter Worth Reading
Building on the idea of smoother troubleshooting, once your observability tools tell you something is wrong, you need a clear plan to fix it. That’s where runbooks and incident response come into play. They are like playbooks for your team, guiding them step by step through known problems. This is key for quickly dealing with aws issues and other unexpected system failures.
Runbooks and Incident Response: Templates, Roles, and Post-Incident Reviews
A runbook is a detailed guide that helps your team resolve common issues. It lays out what to do, who does it, and how to get things back to normal. Think of it as a recipe for fixing specific problems. In 2026, many engineering teams use runbooks to speed up how they handle problems and to make sure everyone follows the same steps.
Essential Runbook Components
A good runbook isn’t just a simple checklist. It has several important parts that make it effective for managing incidents. According to experts, having a clear template helps teams quickly understand "where to look next" during a crisis.
- Pre-approved Mitigations: These are the first things your team should try. For example, if a server is running slow, a runbook might say to restart a certain service. Having these steps ready means less time wasted figuring out what to do first. A helpful Runbook Template: Build Faster Incident Response suggests including "copy-paste-ready commands" for quick action.
- Communications: When an issue happens, who needs to know? This part tells you how to talk to other teams, managers, or even customers. It can include templates for update messages. A robust Incident Management Runbook: The Complete SRE Template for 2026 emphasizes clear communication throughout the incident lifecycle. You might also want to check the AWS Status Guide for Engineering Teams to inform stakeholders about broader cloud service availability.
- Escalation Paths: What if the first steps don’t work? The runbook should clearly say when to ask for more help and who to contact. This avoids confusion and makes sure bigger problems get the right attention quickly. If mitigation doesn’t work, knowing when and how to escalate is crucial, as highlighted in the Security Alliance Runbook Template.
- Automation Hooks: Many runbooks now include ways to automate parts of the fix. This could be a script that automatically checks a log file or restarts a service. Automation makes fixes faster and less prone to human error.
Effective runbooks are essential for preparing for any kind of system failure, from application bugs to widespread aws issues impacting your cloud services.
How to Run Post-Incident Reviews
Even after an incident is resolved, the work isn’t done. Post-incident reviews, also called postmortems, are a critical step for learning and getting better.

They help turn a one-time fix into lasting improvements.
Here’s how to make them count:
- Schedule Quickly: Hold the review soon after the incident, while details are fresh in everyone’s mind. The goal is to learn, not to blame. Many guides suggest scheduling the meeting as soon as possible, as seen in this Incident Response Runbook example.
- Analyze Causes: Look at what went wrong, why it happened, and what steps were taken to fix it. Use your logs, traces, and metrics to get the full picture.
- Create Action Items: This is the most important part. For every problem found, create a specific task to prevent it from happening again or to make the fix faster next time. These tasks become "durable engineering work." This could mean updating a runbook, improving monitoring, or changing some code.
- Update Documentation: If new ways to fix a problem were found, update the runbook. If a new type of
aws issuescame up, add it to your incident knowledge base. - Verify Monitoring: Make sure your monitoring tools would catch this type of problem earlier next time.
By following these steps, engineering teams can transform incidents into opportunities to make their systems stronger and more reliable, ensuring that hard-learned lessons lead to real, long-term improvements.
Sometimes, when your applications act up, it might seem like a full system outage. But actually, often it’s not a complete shutdown. Instead, it’s about how your cloud resources are working, or not working, as expected. These aws issues can make your service run very slow, become hard to use, or even stop working for some people. It’s like having a car that runs out of gas, or a road with too much traffic.
Common Signals of Resource Problems
It’s important to know the signs when performance, cost, or capacity are causing trouble. Here are some common ways these problems show up:
- Throttling: Imagine a busy store that only lets a few customers in at a time. If too many people try to enter, some have to wait. In AWS, this is called throttling. AWS services might slow down your requests if you send too many at once. This protects the service but makes your application feel broken or very slow.
- Cold Starts: If you’re using serverless tools like AWS Lambda, sometimes a function needs to "wake up" if it hasn’t been used for a while. This short delay is called a "cold start." For some users, this delay can make your app feel slow or unresponsive at first. You can learn more about how to make these functions faster and save money in the Most Lambda Bills Are 60% Higher Than Needed guide.
- Autoscaling Misconfigurations: Many cloud services can automatically add or remove resources as needed. This is called autoscaling. But if it’s not set up right, your system might not grow fast enough when lots of people use your app, leading to poor performance. Or it might keep too many resources when not needed, which costs extra money.
- Quota Limits: AWS sets limits on how much of certain things you can use, like how many virtual servers or how much storage. If your app tries to use more than its allowed limit, it can run into problems. This can stop parts of your service from working.
Practical Checks and Quick Fixes
When you see these signs, you need to act fast.
- Check Your Monitoring: Look at your performance dashboards. Are there sudden drops in traffic, many error messages, or delays in how fast things respond? These can point to resource issues.
- Review Logs: Your application logs might show specific error messages about throttling, denied requests, or services being slow to start.
- Check AWS Status: While these issues are often specific to your own settings, it’s always good to check the AWS Status Guide for Engineering Teams to make sure there are no broader problems with
aws services.
For quick fixes to get things working again:
- Temporarily Increase Limits: If you’re hitting a quota limit, you might be able to ask AWS to temporarily raise it.
- Adjust Autoscaling: Tweak your autoscaling rules to be more sensitive or to start with more resources.
- Restart Services: Sometimes, restarting a specific service or server can clear up temporary hiccups.
These quick fixes are like putting a band-aid on a cut. They help right away, but you need a plan for the long run.
Planning for Long-Term Improvements
To truly fix these aws issues, you need to make lasting changes. This often means looking closely at your cloud spending and resource use. Many companies spend too much by having more resources than they actually need, which is called "over-provisioning." This is a big money burner, as explained in the Stop Burning Money on AWS: 2026 Cost Optimization Guide.
Long-term fixes include:
- Right-Sizing: Making sure your servers and services are just the right size for your needs, not too big or too small.
- Optimizing Code: Writing more efficient code for serverless functions to reduce cold starts.
- Automating Resource Management: Setting up systems to manage resources automatically so they grow and shrink as needed without manual work.
- Reviewing Pricing: Making sure you’re using the best pricing plans for your cloud services to save money.
By understanding these common resource-related problems and how to fix them, your team can keep systems running smoothly and avoid issues that look like outages.
Want to stay ahead of all the big changes in tech, including new ways to manage cloud resources and AI tools?
Get clear daily AI updates from The AI Newsletter Worth Reading.
Summary
This guide explains why unexpected AWS issues keep engineering teams awake and gives a practical playbook to respond faster. It walks through a step-by-step triage workflow—detect, prioritize, isolate, mitigate, find root cause, and learn—plus how to use hypothesis-driven debugging to avoid guesswork. You’ll learn how to pick high-value signals from metrics, logs, and distributed traces, and how SLO-based alerting and multi-window rules cut down noisy alerts. The article covers quick checks and mitigations for common failures in EC2, EKS, RDS, S3, and Lambda, and explains broader root causes like IAM, quotas, and networking. It shows observability patterns for actionable logs, tracing, and meaningful metrics, and gives guidance on data retention versus cost. Finally, it outlines runbook structure, escalation, and post-incident reviews so teams can automate responses and turn incidents into lasting improvements.